The TRON Q3 2026 report, dated October 6 and published by TRON DAO Research, provides a quarterly view of network activity. Its figures describe a historical reporting period, not today’s wallet balance or the price of your next USDT transfer. This independent explainer separates the reported findings from practical checks readers can apply to network headlines.
News analysis published October 21, 2026. Source figures are attributed to the report publisher; Tronscan News has not independently audited the underlying dataset. The reading framework below is our analysis, not a claim made by the report or personalized financial advice.
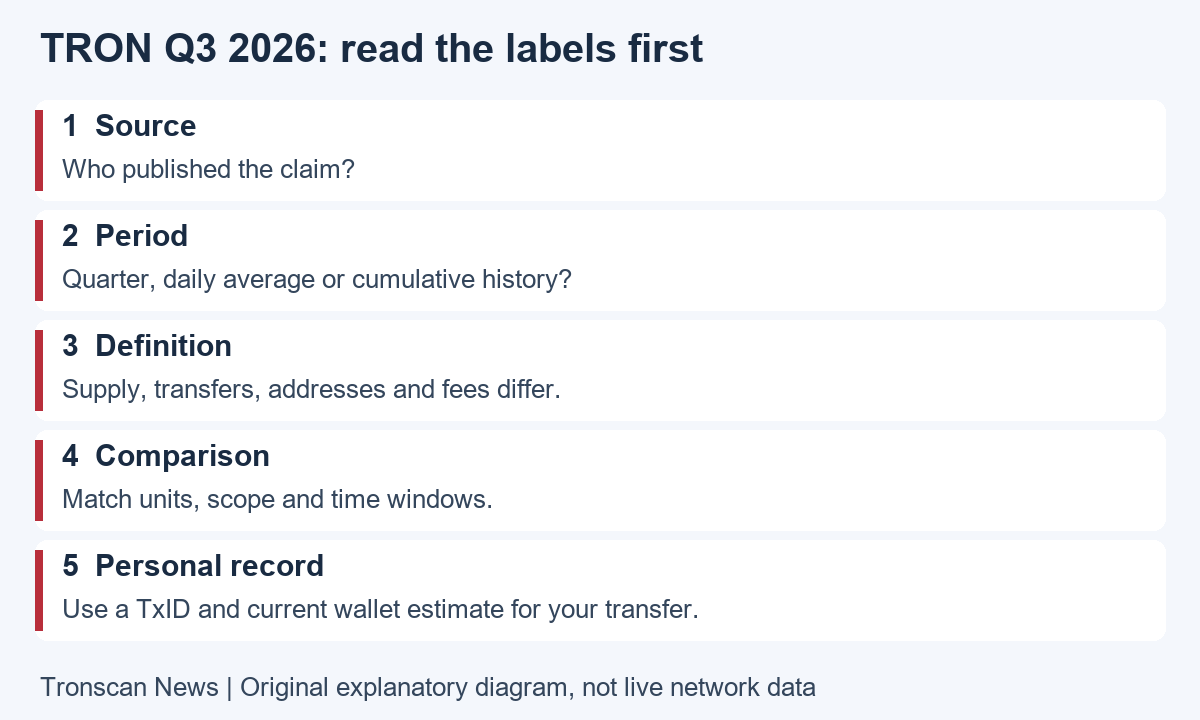
Table of Contents
TRON Q3 2026 key figures at a glance
The report’s $30 trillion headline refers to cumulative transaction volume reached during Q3, not settlement in that quarter alone. Use the labels below to avoid comparing different measurements.
| Reported measure | Figure | How to read it |
|---|---|---|
| Cumulative transaction volume | More than $30 trillion | A running total reached during Q3; not Q3-only volume. |
| Quarterly stablecoin settlement | $2.2126 trillion | Value settled during the Q3 reporting period. |
| Combined USDT and USDD supply | $93.88 billion | Combined supply; not USDT alone or quarterly transfers. |
| Average rolling monthly active addresses | 18 million | Addresses under the report’s method; not a count of unique people. |
These are publisher-reported figures from the October 6 source linked below. They are historical observations, not live balances or a transfer-fee quote.
What the TRON Q3 2026 report says
The primary source is TRON DAO Research’s quarterly report. Among its reported figures are:
- Stablecoin settlement: $2.2126 trillion during the quarter.
- Combined USDT and USDD supply: $93.88 billion.
- Average rolling monthly active addresses: 18 million.
- Average daily transaction-fee observations: $0.643.
These are different measurements. They should not be added together or treated as a count of individual people. The interpretation that follows focuses on how to read a report, not on forecasting token prices from those figures.
5 easy checks for reading TRON Q3 2026 headlines
- Open the primary source. Check who published the claim and whether the link leads to the complete report. A screenshot or short social post may omit qualifications that matter.
- Identify the time window. Distinguish a quarter, a daily average and a cumulative total. Record the period beside the number instead of copying the number alone.
- Define the metric. Ask whether it measures asset supply, transferred value, transactions, addresses or fees. Similar-looking charts can answer very different questions.
- Compare like with like. Keep units, assets, sample scope and observation windows consistent before calculating a change. If the definitions differ, do not present the difference as a clean growth rate.
- Separate your own transaction. Use the actual network, token contract, account, TxID and receipt for a personal payment question. A network headline cannot confirm that your recipient was credited.
The TRON Q3 2026 checklist is useful on a phone because it reduces the temptation to judge a headline by its largest number. Save the source link first, then read the surrounding explanation. You can return to charts later without losing the context that gave the number meaning.
TRON Q3 2026: supply is different from transferred value
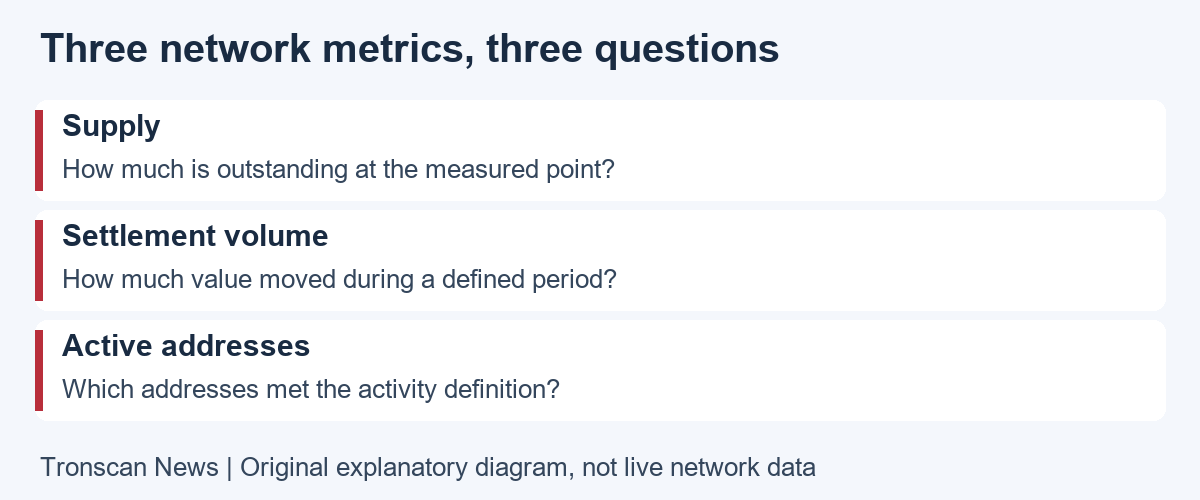
A supply measure asks about an amount outstanding at a defined point or under a defined observation rule. A volume measure asks about activity across a period. Neither should silently be renamed the other when summarizing a report.
Consider a deliberately simplified example unrelated to the actual dataset. If a hypothetical asset has ten units outstanding and the same units change hands repeatedly, the total transferred over time can exceed ten units. That does not require the outstanding supply to increase by the same amount. The example explains units of measurement, not any particular network’s behavior.
Also preserve the asset scope. A combined figure for two assets should not be labelled as the supply of only one. If a chart aggregates multiple tokens, keep that description in your notes. An attractive headline becomes misleading when the qualifier disappears during copying.
For a personal holding, the useful question is much narrower: which verified token does this address currently hold, and how many units? Our TRON address balance guide explains how to keep token quantity separate from a price-based portfolio estimate.
TRON Q3 2026: addresses are not automatically people
An address-based statistic counts addresses according to an activity definition. It does not, by its label alone, identify how many distinct human beings participated. One person may use several accounts, while a service may operate addresses for many customers. Avoid converting an address chart into a population claim without evidence for that conversion.
The official TRON account documentation distinguishes ordinary accounts controlled through keys from contract accounts controlled by code and access rules. That basic distinction is another reason to read the metric definition instead of assuming every address represents the same type of participant.
Ask how activity is defined. Does the measurement refer to a calendar month, a rolling window, senders, recipients or some other qualifying action? If the source does not answer the question you need, record that limitation. Do not invent a definition just because a chart’s label is short.
Our reading of this issue is methodological: broader address activity may be interesting, but it is not a substitute for a carefully defined user study. A useful summary says what was measured and leaves unrelated questions open.
TRON Q3 2026 fee averages are not a wallet quote
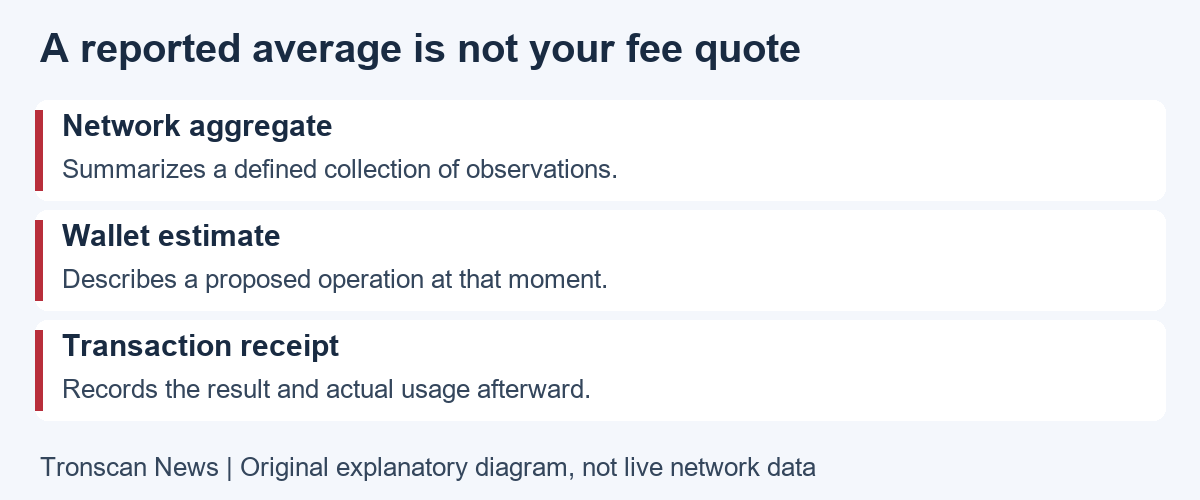
An aggregate fee observation summarizes a collection of activity. A wallet estimate concerns a proposed operation at a particular moment. A receipt records what happened after execution. Keep those three types of evidence separate, even if all are displayed with a currency symbol.
The TRON resource model distinguishes Energy used for contract computation from Bandwidth associated with transaction size. A native transfer and a token-contract operation therefore need to be understood in their own context. A headline average cannot tell you the complete resource position of a specific sending account.
Before signing, review the actual token, recipient, action and estimate in the wallet you use. After execution, inspect the receipt. Our TRON Energy and Bandwidth guide covers that process without promising a fixed transfer price.
Also ask whether an advertised cost is a network charge, an exchange withdrawal fee or a separate service price. Two numbers may legitimately differ because they describe different services. Comparing them without naming the underlying charge makes it harder to identify a real discrepancy.
A quarterly report cannot confirm a personal deposit
A report about network-scale usage does not establish that one payment reached the intended address or that a receiving platform updated its internal ledger. For that question, start with the actual transaction hash and inspect the relevant transfer record.
Use our mobile transaction lookup guide to check execution, confirmation, asset, recipient and quantity. Keep the network report as background context rather than using it to fill gaps in a payment investigation.
For example, if a hypothetical exchange deposit has not appeared, an adoption headline cannot explain the delay. Preserve the TxID and compare the receiving service’s current deposit instructions. Contact its official support about internal crediting, using evidence tied to that particular payment.
A public explorer is a record-reading tool. It cannot turn a general network statistic into proof of account ownership, recipient identity or a platform’s obligation to credit a particular customer. Those are separate questions with their own evidence.
How to compare the TRON Q3 2026 report with another period
Start by building a small comparison note with one metric per line. Include the original name, unit, asset scope, start and end dates, and publisher. Only then add a second observation. This prevents a daily average from being placed beside a full-quarter total as if the labels were interchangeable.
Check whether the publisher revised an earlier figure or changed the measurement method. If so, use an explicitly comparable series when one is provided. A previous article’s rounded number may not be an appropriate denominator for a precise percentage calculation.
Do not create a growth rate when a required value is missing. Write that the comparison is unavailable and explain what evidence would complete it. An empty spreadsheet cell is more honest than a zero invented to make the formula run.
Keep rounding consistent. A rounded headline and a more detailed table can refer to the same observation at different precision. Preserve the source precision in your working note and avoid presenting an extra decimal as if it represented extra certainty.
Read source incentives alongside TRON Q3 2026 claims
A first-party report is useful for understanding what the organization is reporting. It should also be identified as first-party material. Attribution allows readers to distinguish a publisher’s claims from independent verification of the underlying records.
When evaluating a TRON Q3 2026 conclusion, ask what supporting material is available: definitions, methodology notes, source links and a reproducible observation window. A claim may be clear enough to quote in a short attributed summary while still lacking the evidence necessary for a broader causal conclusion.
For instance, an observed change in one metric does not by itself establish why it changed. Several variables may move together. In our analysis, the safer reading practice is to describe the observation first and label any proposed explanation as an interpretation rather than a proved cause.
This applies in both directions. Do not turn positive activity figures into an investment guarantee, and do not treat a single declining metric as proof that an entire network has failed. Define the question before deciding which evidence is relevant.
What this TRON Q3 2026 analysis does not establish
This TRON Q3 2026 article does not independently reproduce the report’s dataset, audit a token contract or assess the suitability of an investment. It also does not establish today’s live supply, current transaction cost or any particular service’s availability. Those require current sources and checks suited to the question.
If you want to understand a product mentioned in a network report, open that product’s own current documentation. Confirm what is available, which users or regions are eligible, and what limitations apply. A partnership announcement alone is not a complete set of operating instructions.
For a mobile reader of TRON Q3 2026 coverage, this boundary can save time. Decide whether your task is understanding a headline, checking a holding, tracing a transfer or assessing a service. Start with the evidence for that task rather than collecting unrelated statistics.
Keep a useful TRON Q3 2026 reading note
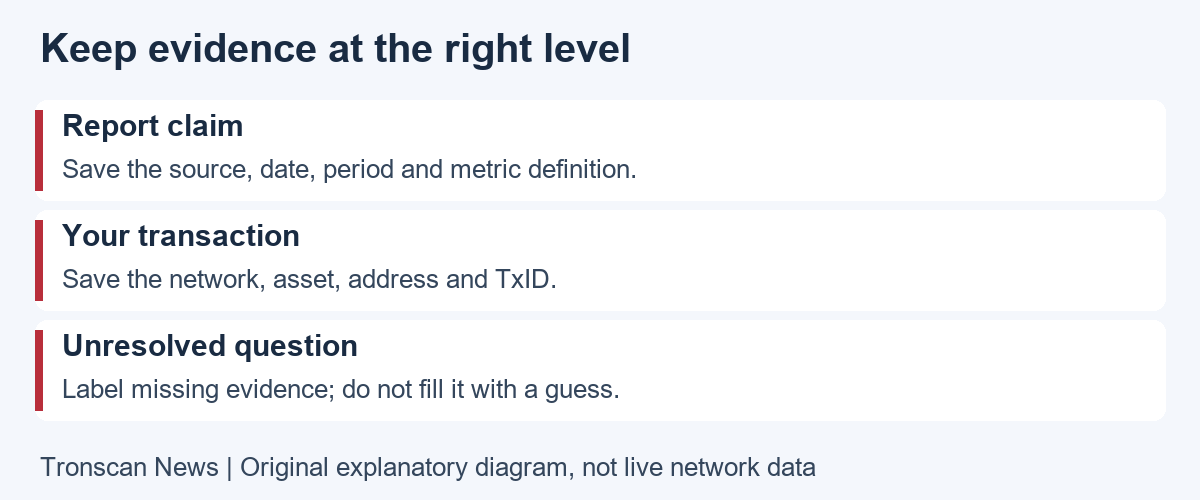
Save the primary URL, publisher, publication date and reporting period. For each selected metric, preserve its exact label and unit. Add a short line explaining what the observation does and does not answer. Keep your own comments visually separate from the publisher’s figures.
If you later share a TRON Q3 2026 note, include enough context for another reader to reopen the source. A cropped chart without a period or definition can spread a mistake even when the original report was clear. Do not add a fresh date that makes a historical observation look current.
When correcting an error, identify the affected claim and explain what changed. A correction may involve a copied unit, a missing qualifier or a mistaken comparison. Replacing the whole note without saying which point changed makes it harder for readers to update their understanding.
Finally, keep private financial information out of public discussion. A network report does not require your recovery phrase, private key or login code. If you use a personal transaction as an example, consider what linked public activity the address reveals before sharing it.
Frequently asked questions
1. Is the TRON Q3 2026 report live network data?
No. It is a period-based report. Check its publication date and reporting window before using a figure. A current wallet or payment question needs a current account record or transaction receipt rather than a historical summary.
2. Does a high settlement volume tell me my transfer arrived?
No. Trace the particular TxID and check the asset, recipient, quantity and execution result. If an exchange’s customer balance is involved, its internal crediting process is a separate question for its official support.
3. Can I treat active addresses as unique users?
Not without a methodology that supports that interpretation. Addresses are technical identifiers and can have different roles. Preserve the publisher’s metric label instead of replacing it with an unsupported count of people.
4. Should a reported average fee match my wallet estimate?
Not necessarily. They describe different observations. Review the exact operation and account resources, then compare the estimate with the completed receipt. Also separate network costs from platform or withdrawal charges.
5. Does this report predict TRX returns?
This analysis makes no return forecast. Network measurements can inform a discussion of activity, but they do not establish a future price, guaranteed profit or the suitability of a financial decision for an individual reader.
Continue reading
Use the three linked tutorials above for personal holdings, transaction status and resources. Visit the Tronscan News homepage for further independent explainers. Our editorial standards explain source attribution, AI assistance and corrections.
Leave a Reply