TRON card volume is a share of a defined payment dataset, not every dollar moving on TRON. This dated audit shows how to attach the correct denominator to a quarterly figure, reproduce the arithmetic and handle a growth rate that differs from a calculation using rounded totals. You can follow the method without connecting a wallet or buying a data service.
Checked October 28, 2026. We reviewed a report published on October 19, not a new announcement today. Tronscan News is an independent publication. This article used AI assistance and editorial source checks; its original calculations and local tests are described below. We did not recreate the underlying card-payment dataset, identify cardholders or test a payment product.
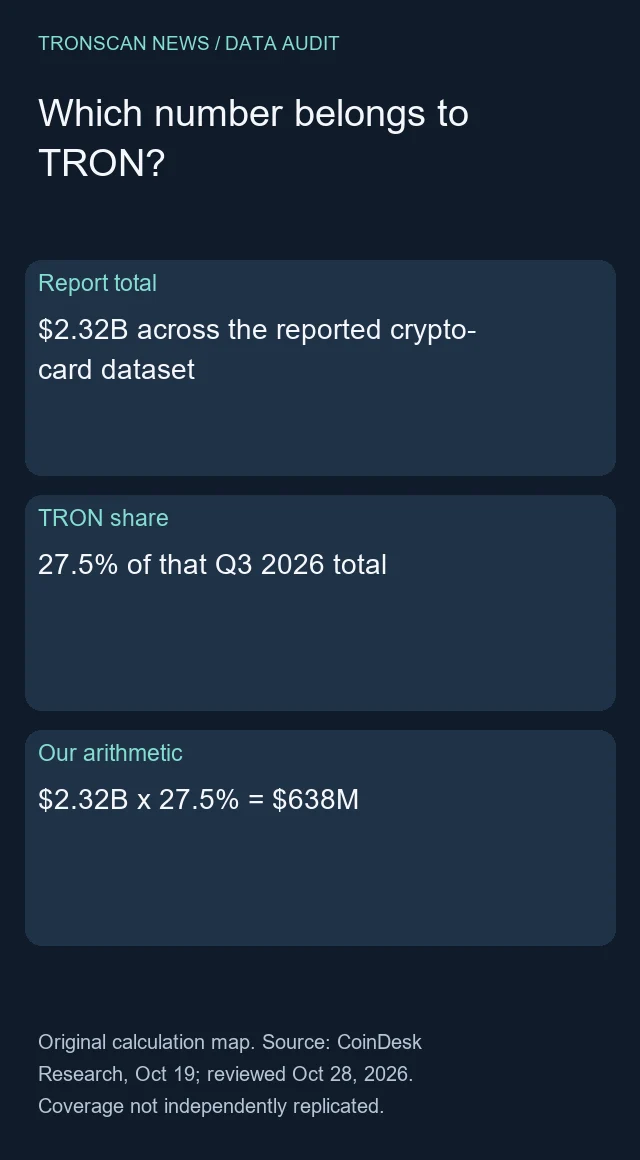
Table of Contents
1. Establish the TRON card volume source and period
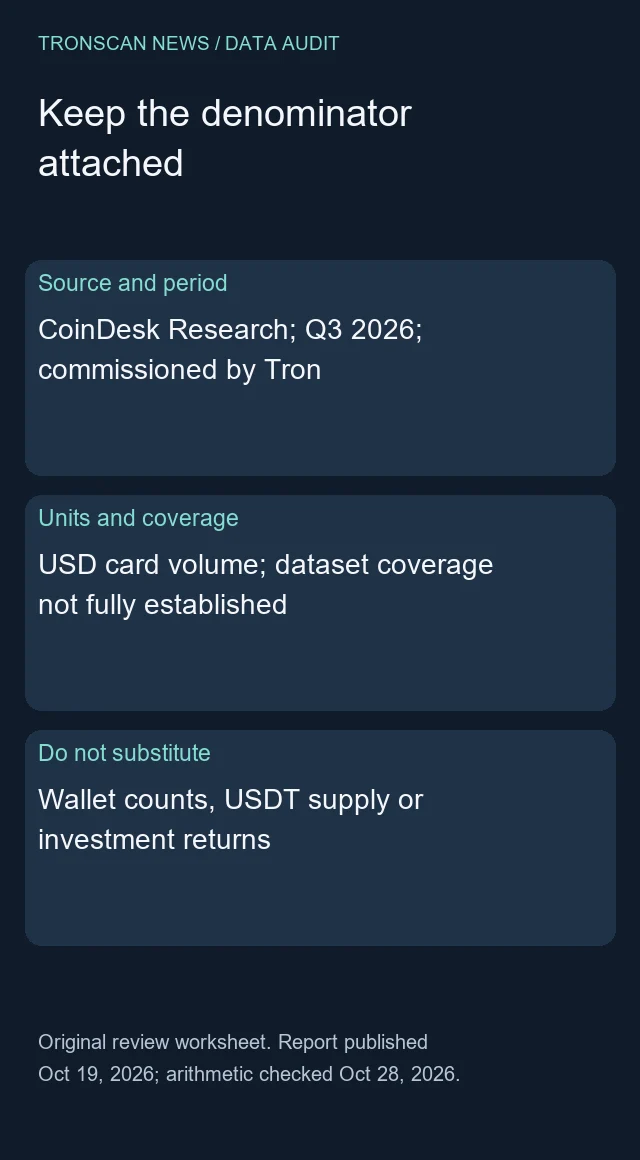
CoinDesk Research’s TRON Network Q3 2026 report was published October 19 at 9:30 a.m. EDT and updated at 9:56 a.m. It discloses that Tron commissioned the research. Its card discussion gives a cross-chain quarterly total of $2.32 billion, compared with $1.44 billion in Q2, a reported growth rate of 60.5%, and a TRON share of 27.5%, or approximately $638 million.
Those are source observations. Our remaining tables and calculations audit how to interpret them. We have not independently established the complete issuer list, chain coverage, raw unrounded totals or rounding convention. Commissioning is relevant context, but neither proves nor disproves the numerical claims. A responsible review keeps the disclosure beside the evidence rather than treating it as an arithmetic shortcut.
The task is successful when another reader can reproduce our calculations, identify which quantities came from the report and explain what further evidence would be needed for a stronger claim. It is not successful merely because a calculator produces the same headline number. A result with the wrong period or denominator can be mathematically tidy and still answer the wrong question.
For the broader network context, our earlier Q3 TRON report overview covers a different source and general network metrics. This article keeps that existing overview and concentrates on a separate task: auditing the card dataset’s denominator and displayed precision.
2. Build a TRON card volume input ledger
Before opening a spreadsheet, write down one row per quantity. Keep units in the column name, not in your memory. In this example B means billions of US dollars and M means millions. The period is a quarter; the figures are not daily observations or a cumulative lifetime counter.
| Input | Saved decimal string | Role in this audit |
|---|---|---|
| Q2 cross-chain card total, USD billions | 1.44 | Growth denominator |
| Q3 cross-chain card total, USD billions | 2.32 | Share denominator and growth numerator |
| TRON percentage share | 27.5 | Multiplier after dividing by 100 |
| Reported growth percentage | 60.5 | Source statement to compare, not an input used to force agreement |
| Reported approximate TRON amount, USD millions | 638 | Comparison against our point calculation |
Keep the denominator description attached when you copy this table. Removing the phrase cross-chain card total makes it easy to mislabel the larger amount as TRON-only activity. Removing the word card invites another mistake: comparing it directly with every on-chain token transfer, even though those datasets may measure different activity.
Record the report’s date separately from your retrieval and calculation dates. A review written later does not move the observations into a later quarter. If a corrected source appears, preserve the original capture and create a new version of the ledger. That allows a later reader to see whether a changed conclusion came from new source data or from your method.
3. Reproduce the TRON card volume point estimate
Convert the percentage to a fraction first: 27.5 / 100 = 0.275. Then multiply the Q3 denominator by that fraction. Our displayed-value calculation is 2.32 billion USD × 0.275 = 0.638 billion USD = 638 million USD. This arithmetic matches the approximate amount quoted in the report.
The equality establishes consistency between the displayed share and total. It does not independently measure payments. If both source inputs came from the same underlying process, recombining them is a useful transcription check, not a second independent dataset. Label the result calculated from reported values instead of independently verified payment volume.
A percentage point and a percentage change are also different. The share is a portion of a total. Growth compares one period with another. You cannot subtract the share from the reported growth to obtain a meaningful payment metric, and neither number tells you how many people used a card.
Synthetic error exercise: imagine a worksheet multiplies 2.32 by 27.5 without dividing by 100. Its result is one hundred times the intended fraction-based amount. Another worksheet divides the billion-dollar result by a million in the wrong direction and changes the scale again. Keep the intermediate fraction and both unit labels visible so either error can be spotted before the number is reused.
For a separate explanation of token quantities and valuation displays, see our USDT amount versus USD value guide. A payment metric denominated in dollars should not be silently relabelled as a count of tokens or a wallet’s spendable balance.
4. Compare growth without inventing missing precision
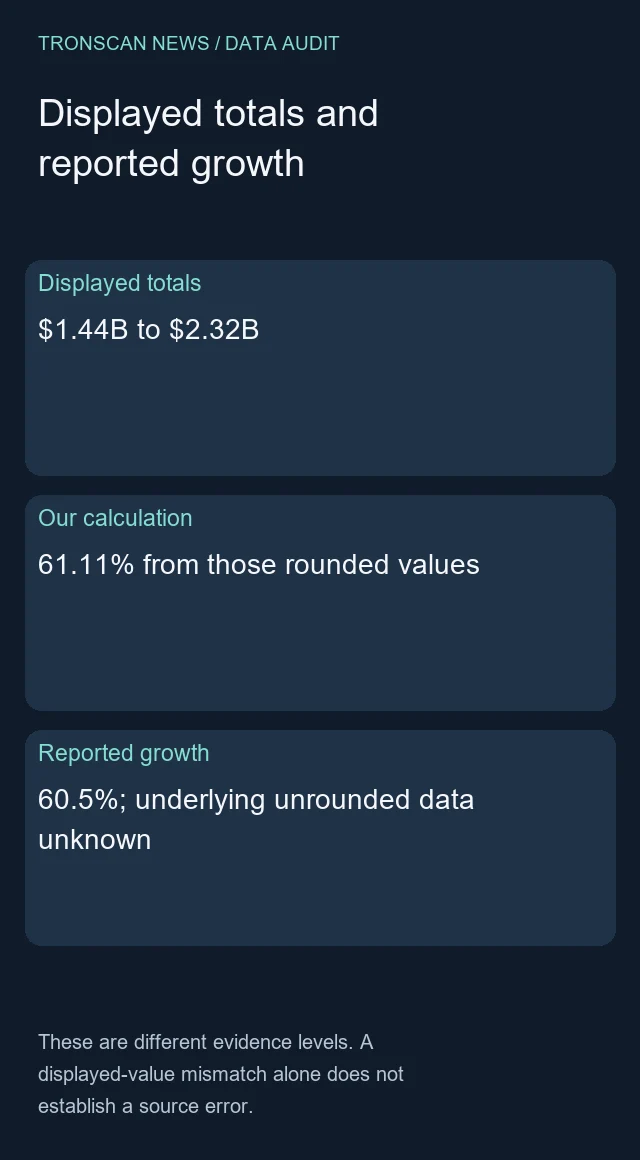
The usual displayed-total growth calculation is (Q3 / Q2 − 1) × 100. Using the saved values produces about 61.11%. That differs from the source’s stated 60.5%. Keep both in your notes: one is our calculation using displayed rounded values, and the other is the report’s stated growth.
That difference alone does not establish a report error. The underlying unrounded inputs and exact rounding method were not available to this audit. Do not replace the source’s growth rate with our result and imply that we recovered the original raw series. Equally, do not alter an input until the output happens to agree.
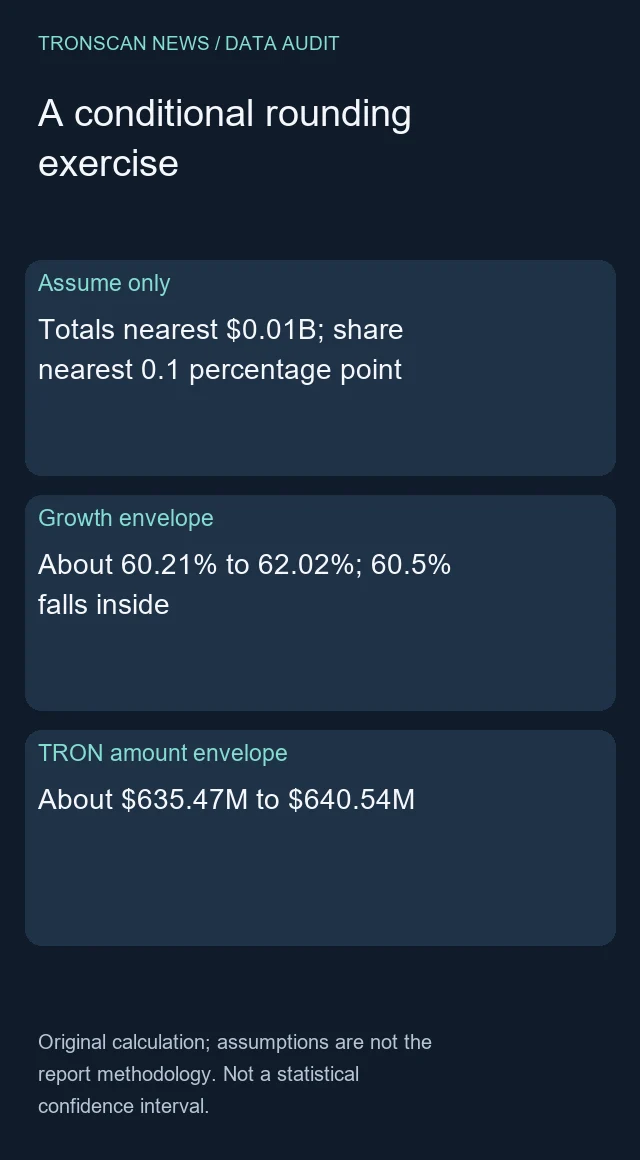
Our next step is deliberately conditional. Suppose the totals were rounded to the nearest 0.01 billion dollars and the share to the nearest 0.1 percentage point. These are our exercise assumptions, not a verified description of the report’s production process. Under those assumptions, the possible pre-rounded inputs occupy small ranges around their displayed values.
| Conditional input | Approximate lower boundary | Approximate upper boundary |
|---|---|---|
| Q2 total, USD billions | 1.435 | 1.445 |
| Q3 total, USD billions | 2.315 | 2.325 |
| TRON fraction | 0.2745 | 0.2755 |
Endpoint inclusion depends on the tie-breaking convention, which we have not established. For this explanation the boundaries are approximate envelopes. They are not a statistical confidence interval, an estimate of sampling uncertainty or evidence that the actual values were near either endpoint.
The smallest growth in this exercise uses the smaller Q3 numerator and larger Q2 denominator. The largest uses the larger numerator and smaller denominator. This gives approximately 60.21% to 62.02%. The reported 60.5% falls inside that envelope. Our defensible conclusion is compatibility under stated assumptions, not verification of the raw growth rate.
Multiplying the smallest assumed total by the smallest assumed share gives approximately $635.47 million; multiplying the two largest gives approximately $640.54 million. This explains why the point result should not be presented with manufactured measurement precision. Extra decimal places in a program’s output are arithmetic digits, not extra information from the source.
5. Run the local TRON card volume audit
The following original Python example uses only the standard library and saved input strings. It makes no network request, opens no account and submits no payment. Save it as audit_card_data.py alongside source-inputs.json. Copy the four calculation inputs using the exact JSON key names below. Keep the reported approximate amount separately as the comparison result.
{"cross_chain_Q2_B":"1.44","cross_chain_Q3_B":"2.32","tron_share_percent":"27.5","reported_growth_percent":"60.5"}Run python audit_card_data.py in that folder. Decimal strings avoid introducing binary floating-point display artifacts into a precision exercise. A local precision of fifty digits makes intermediate arithmetic reproducible; it does not turn the source into fifty-digit measurements.
import json
from decimal import Decimal, localcontext
from pathlib import Path

def number(value):
    if not isinstance(value, str):
        raise ValueError("Use decimal strings from the source worksheet")
    result = Decimal(value)
    if not result.is_finite():
        raise ValueError("Expected a finite decimal")
    return result

def audit_card_data(inputs):
    q2 = number(inputs["cross_chain_Q2_B"])
    q3 = number(inputs["cross_chain_Q3_B"])
    share_percent = number(inputs["tron_share_percent"])
    reported_growth = number(inputs["reported_growth_percent"])
    if q2 <= 0 or q3 <= 0 or not 0 <= share_percent <= 100:
        raise ValueError("Invalid denominator or share")
    with localcontext() as context:
        context.prec = 50
        share = share_percent / 100
        point_tron_M = q3 * 1000 * share
        rounded_growth = (q3 / q2 - 1) * 100
        # Conditional exercise only: nearest 0.01B and nearest 0.1 percentage point.
        volume_half_step = Decimal("0.005")
        share_half_step = Decimal("0.0005")
        if q2 <= volume_half_step or not share_half_step <= share <= 1-share_half_step:
            raise ValueError("Outside this rounding exercise's scope")
        growth_low = ((q3-volume_half_step)/(q2+volume_half_step)-1)*100
        growth_high = ((q3+volume_half_step)/(q2-volume_half_step)-1)*100
        tron_low_M = (q3-volume_half_step)*1000*(share-share_half_step)
        tron_high_M = (q3+volume_half_step)*1000*(share+share_half_step)
        return {
            "point_tron_volume_M": str(point_tron_M),
            "growth_from_displayed_totals_percent": str(rounded_growth),
            "conditional_growth_low_percent": str(growth_low),
            "conditional_growth_high_percent": str(growth_high),
            "reported_growth_inside_conditional_range": growth_low < reported_growth < growth_high,
            "conditional_tron_low_M": str(tron_low_M),
            "conditional_tron_high_M": str(tron_high_M),
            "scope": "Assumed rounding ranges, not raw data or a statistical confidence interval"
        }

if __name__ == "__main__":
    inputs = json.loads(Path("source-inputs.json").read_text(encoding="utf-8"))
    print(json.dumps(audit_card_data(inputs), indent=2))
Our actual run returned a point amount of 638 million dollars, displayed-total growth of about 61.11%, the conditional ranges above and a true compatibility flag. The flag means only that the stated growth falls strictly between our assumed lower and upper growth boundaries. It is not a pass certificate for the report’s collection methodology.
We also ran five synthetic local checks. A zero Q2 denominator, a share above one hundred, a non-finite value and a boolean input were rejected. Replacing the reported growth with a hypothetical seventy percent produced a false compatibility flag. These altered values are test fixtures, not additional observations about TRON.
The program is intentionally narrow. It requires positive quarterly totals and a share away from the edge of its assumed rounding range. It does not handle every possible unit, negative revision or missing-value convention. If another dataset falls outside those conditions, adapt and test the method before drawing a conclusion; do not force the data through this sample.
6. Keep card metrics separate from other TRON data
A card-volume series measures an activity flow over a period. A token supply snapshot measures a stock at a point in time. Transaction counts measure records, while account counts measure another entity again. They may be useful together, but arithmetic across those columns requires a defined relationship and matching scope.
Our dated TRON USDT activity review explains a separate transfer-data task. Neither that series nor this card review should be renamed to make the two appear interchangeable. Retain the dataset’s asset, activity filter, time window and coverage when comparing them.
Synthetic comparison exercise: a hypothetical chart places quarterly card dollars beside a one-day transfer count and calls their ratio adoption. The units and periods do not define a useful adoption rate. Correct the labels and identify a suitable denominator before calculating anything. A visually attractive chart does not repair an undefined metric.
A large dollar flow also does not establish distinct cardholders, merchants, profitable businesses or a particular token’s future return. Those require their own definitions and evidence. We did not inspect private cardholder data and do not infer personal identities from this aggregate report.
7. Use a TRON card volume review worksheet
This original on-page worksheet helps a reader review the next report. It is a note template, not an externally downloadable dataset. Fill each field with an observed fact or an explicit unknown, then attach the exact calculation used for any derived column.
| Worksheet field | Question to answer | Failure branch |
|---|---|---|
| Source and disclosure | Who published it, when, and under what commissioning disclosure? | Keep provenance unresolved if the original is unavailable |
| Activity and denominator | Which payments, chains and issuers form the total? | Do not claim complete market coverage without evidence |
| Period and units | Quarter or day; dollars, tokens or records? | Do not combine incompatible columns |
| Displayed precision | What rounding is visible and what rule is actually documented? | Label any assumed rule as conditional |
| Calculation and limits | Can another reader reproduce the arithmetic and its boundaries? | Preserve unknown raw inputs rather than fabricating them |
If a future revision supplies raw totals, rerun the same method with a separately versioned input file. Compare like periods and coverage before describing a trend. If coverage changes, the first question is comparability, even when both reports use the same metric name.
If the source cannot be fetched, retain the last verified capture and its date. Do not describe it as a live dashboard. If a calculation fails validation, correct the specific input or scope problem and rerun the tests; an exception is not a numerical zero.
More English record-reading tutorials are available from the Tronscan News homepage. Choose the next source according to the unanswered question: source precision, payment coverage or a different on-chain metric. Keeping those questions separate makes later corrections easier to trace.
8. Decide what evidence would resolve the remaining questions
The next useful step depends on the uncertainty. If the question is arithmetic, the saved inputs and program are enough to reproduce this audit. If the question is coverage, repeating the same multiplication will not help. You would need a documented issuer list, inclusion criteria and treatment of overlapping activity from the data producer.
For a growth comparison, ask whether both quarters used the same definition. A newly included issuer can increase a reported total without representing an equal increase in activity among an unchanged group. This is a general comparability problem, not a claim that the reviewed report changed its coverage. Our evidence does not establish whether that happened.
For a dollar valuation comparison, ask when and how conversions were applied. A number described as USD volume may come from a particular reporting process; the label alone does not reveal the exchange-rate convention or treatment of reversed activity. This audit did not establish those details and therefore does not offer an alternative adjusted payment total.
Synthetic scope exercise: suppose a later report includes one additional issuer but the earlier quarter is left unchanged. Its two published totals can still be quoted accurately, yet a claim of like-for-like growth would need more work. Preserve both versions, identify the coverage change and request a comparable series rather than silently filling the gap with a guessed correction.
Synthetic rounding exercise: suppose another source supplies values with three decimal places in billions. Do not reuse our half-step of 0.005 merely because the subject is still card activity. Derive the half-step from the stated precision and keep the assumption separate from the actual rounding convention. If truncation rather than nearest rounding was used, the symmetric range in this example would be the wrong model.
For a claim about people, first define whether an entity is an account, card, customer or active person. One aggregate dollar figure supplies none of those counts. Even a separately reported count would need a clear deduplication and activity window before being compared with another provider’s number.
Use a short decision note after each review: the question, observed source, calculation performed, unresolved input and next evidence required. For this review, the share multiplication is reproducible and the rounding compatibility is conditional. Full dataset replication remains unperformed. Keeping those outcomes in different rows prevents a successful arithmetic check from being promoted into a broader assurance.
If the publisher later provides a methodological explanation, attach it with its date and rerun only the affected calculation. Do not rewrite the earlier observation as though the explanation had been available from the start. A versioned review lets the reader follow the change and makes a correction specific enough to verify.
Frequently asked questions
Is the larger card total a TRON-only figure?
No. In the reviewed report it is the cross-chain denominator. TRON’s share is a separate input, and the approximate TRON amount follows from multiplying that share by the denominator.
Does the displayed-total growth difference prove the report is wrong?
No. The underlying unrounded totals and exact rounding convention were not established. Our exercise shows compatibility under explicit assumptions, not a reconstruction of raw data.
Is the conditional TRON card volume range a confidence interval?
No. It is a deterministic calculation under assumed rounding steps. It does not measure sampling error, establish dataset coverage or assign probabilities.
Does TRON card volume equal all TRON USDT transfers?
No such equivalence was established. Card-payment coverage and on-chain transfer filters are different definitions and need separate source checks.
Does the local audit connect a wallet or make a payment?
No. It reads a saved JSON input file and performs decimal arithmetic locally. It neither signs transactions nor accesses cardholder accounts.
Leave a Reply