USDT activity on TRON totaled approximately $734.471 billion in source-reported transfer USD amounts across the thirty category dates from 27 September to 26 October 2026. Our calculation uses a saved official TRONSCAN response for the TRON USDT contract. It does not measure net capital inflow, new investment, transaction count or unique people.
The daily mean was approximately $24.482 billion and the median approximately $29.490 billion. Those different summaries describe the same thirty observations. The mean incorporates the magnitude of every daily amount; the median identifies the midpoint after sorting. Neither is a promise about a future day.
We collected the response on 27 October 2026 at 04:45 UTC and recomputed this exact thirty-date window locally. These are prior-date observations, not an independently certified final dataset. The provider’s valuation method and precise daily boundary were not independently reconstructed for this review.
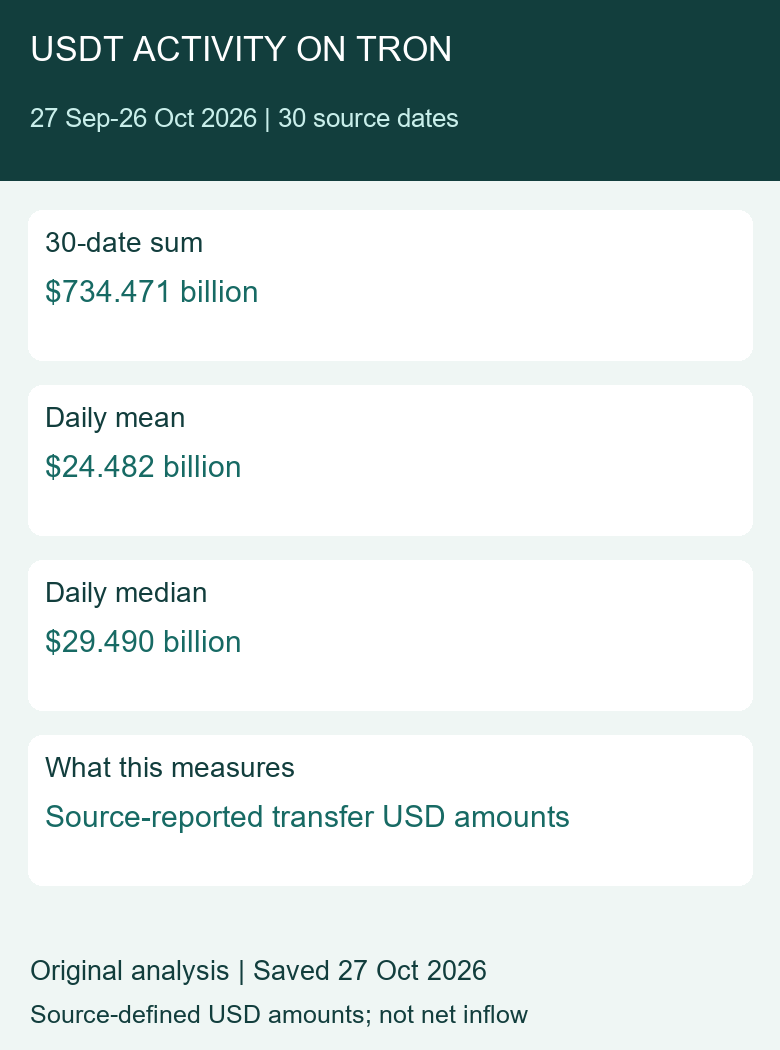
Table of Contents
USDT activity: scope before interpretation
This report selects TR7NHqjeKQxGTCi8q8ZY4pL8otSzgjLj6t, the TRON USDT contract used in our request. Check the applicable network and contract against the issuer’s supported-protocol reference when reproducing the selection. A token symbol alone cannot establish the same scope.
The response originally covered thirty-five dates. We retained only the thirty requested dates and ignored the endpoint’s average for its longer response window. Applying an average from one window to a differently filtered table would be a calculation error even if the numbers looked close.
For a reader checking one payment, this aggregate USDT activity report answers the wrong question. A network-level transfer amount cannot confirm your recipient, the execution of your hash or a private exchange credit. Use the TRON USDT record guide for that task.
USDT activity: thirty retained source observations
Each row below is the source’s dated USD amount, rounded to cents for display. We calculated totals with the retained decimal strings before rounding. This display precision does not imply that the upstream valuation methodology was audited to a cent.
| Source date | USD amount, display rounded |
|---|---|
| 2026-09-27 | 9,624,556,592.65 |
| 2026-09-28 | 30,893,017,309.50 |
| 2026-09-29 | 30,064,423,923.39 |
| 2026-09-30 | 30,295,038,656.93 |
| 2026-10-01 | 24,954,419,236.72 |
| 2026-10-02 | 28,491,120,881.82 |
| 2026-10-03 | 12,123,183,953.45 |
| 2026-10-04 | 9,371,562,078.66 |
| 2026-10-05 | 30,086,259,011.84 |
| 2026-10-06 | 26,765,340,612.18 |
| 2026-10-07 | 28,750,583,508.06 |
| 2026-10-08 | 32,606,034,870.80 |
| 2026-10-09 | 32,320,975,733.75 |
| 2026-10-10 | 14,105,337,091.09 |
| 2026-10-11 | 10,774,568,921.11 |
| 2026-10-12 | 27,145,929,829.63 |
| 2026-10-13 | 32,320,828,824.62 |
| 2026-10-14 | 30,012,238,741.87 |
| 2026-10-15 | 31,848,551,430.54 |
| 2026-10-16 | 31,093,540,408.25 |
| 2026-10-17 | 12,797,802,988.08 |
| 2026-10-18 | 9,061,183,911.52 |
| 2026-10-19 | 28,967,869,025.48 |
| 2026-10-20 | 31,673,883,033.29 |
| 2026-10-21 | 32,217,776,518.25 |
| 2026-10-22 | 31,310,633,044.99 |
| 2026-10-23 | 30,090,850,206.81 |
| 2026-10-24 | 12,847,757,227.44 |
| 2026-10-25 | 9,586,673,019.62 |
| 2026-10-26 | 32,269,139,487.09 |
The dates form a continuous sequence of thirty observations. We checked the row count, duplicate dates, consecutive dates and nonnegative amounts. No absent observation was replaced with zero, and no current-date row was needed to complete the selected range.
Missing data and zero activity are different statements. If a future response omits a date, a comparison should disclose that gap or use another explicitly defined window. It should not quietly treat the missing date as an exceptionally quiet day.
How the daily mean differs from the median
The mean is the thirty-date sum divided by thirty: $24,482,369,335.980618 in the retained calculation. It is useful for reconciling the total to an equal daily allocation. It does not identify a day that actually occurred, because no observation has to equal the arithmetic mean.
The median is $29,490,053,883.674153. With thirty observations, we sorted the amounts and averaged the two central values. This statistic describes the center of the ordered sample. The large difference from the mean indicates that the two summaries should not be casually substituted for each other.
In this USDT activity window, lower-amount observations pull the arithmetic mean below the median. That is a description of the observed distribution, not a causal account of why specific days were lower. We have not attributed the pattern to geography, exchange schedules, users or an announcement.
Choosing only the statistic that makes activity appear largest would conceal useful context. We show the sum, mean and median together so that readers can distinguish accumulated activity from a typical-observation summary. The chart labels are rounded for mobile readability; the calculation retains the original precision.
The highest and lowest source dates
The largest retained daily amount was $32,606,034,870.800726 on 8 October. The smallest was $9,061,183,911.523365 on 18 October. The ratio of those amounts is approximately 3.598. This is the range within the chosen thirty-date series, not an all-time high or low.
A large single-day USDT activity number is not evidence of a matching amount of newly issued tokens. Existing units may move repeatedly between addresses. Counting the value of each movement can produce a cumulative transfer amount much larger than the stock of tokens at a particular moment.
Nor does a high amount demonstrate that more individuals used the network. A few large movements and many small movements can contribute similar amounts while representing very different transaction counts. Address control and unique-person attribution require separate evidence that this response does not provide.
The date labels help locate an observation for further investigation. They do not identify the precise intraday cause. We would need appropriately scoped transaction evidence, consistent timestamps and a defined attribution method before describing the behavior behind an extreme.
Compare two equal seven-date windows
The seven category dates from 20 through 26 October sum to $179,996,712,537.487035. The immediately preceding seven dates, 13 through 19 October, sum to $176,102,015,330.353849. The difference is $3,894,697,207.133186, approximately 2.211614% of the preceding window.
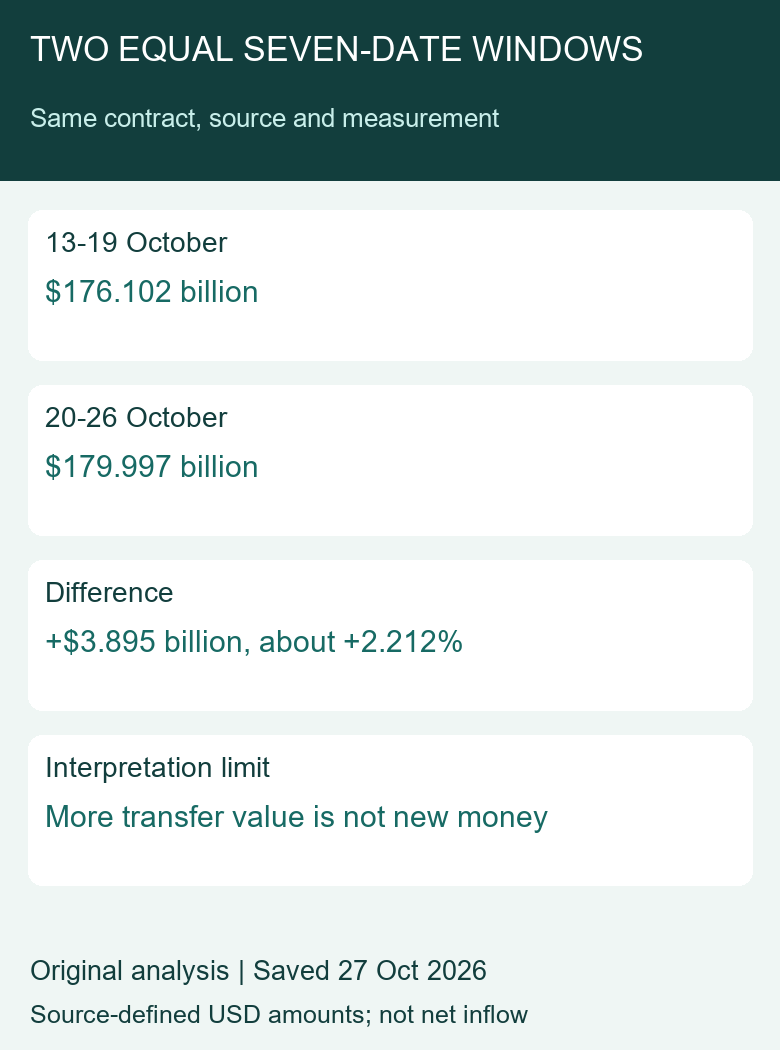
Equal window lengths avoid one obvious distortion: comparing seven dates with a shorter or longer interval. They do not remove every source of variation. The comparison remains dependent on consistent source coverage, valuation and date conventions.
The denominator matters. We divided the signed difference by the preceding seven-date sum. Dividing it by the recent sum would answer a different question and produce a different percentage. A report should state its comparison base instead of showing an unexplained growth rate.
This USDT activity comparison is descriptive. Two adjacent windows do not establish a persistent trend or statistical significance. They also do not explain whether the change reflects more transfers, different transfer sizes, repeated circulation or another composition effect.
We deliberately retained the rest of the thirty-date table. Readers can see that the two seven-date comparisons are subsets of a larger window rather than mistaking them for the complete dataset. A future review should use an equally explicit selection rule.
Reconcile the whole window with nonoverlapping blocks
To check that the recent comparison did not lose or double-count rows, we also partitioned the thirty dates into one opening two-date block and four seven-date blocks. Every retained date belongs to exactly one block. Adding their unrounded amounts reproduces the thirty-date total.
| Source-date range | Dates | USD amount |
|---|---|---|
| 27-28 September | 2 | 40,517,573,902.15 |
| 29 September-5 October | 7 | 165,386,007,742.80 |
| 6-12 October | 7 | 172,468,770,566.63 |
| 13-19 October | 7 | 176,102,015,330.35 |
| 20-26 October | 7 | 179,996,712,537.49 |
These blocks are an authored reconciliation method, not named calendar weeks supplied by the API. Their boundaries follow the end of our chosen window. Another reviewer may choose another explicitly documented partition, but should not call differently selected ranges the same comparison.
The opening two-date block must not be compared directly with a seven-date total to claim a sharp increase. It contains fewer observations. Its role is to account for the two dates left after four complete seven-date blocks, so that all thirty source rows remain visible in the reconciliation.
Among the four equal-length blocks, the amounts increase from the earliest retained block to the latest. That pattern belongs to this particular partition of the source-defined USDT activity measure. It does not prove that every daily observation increased; the full table contains substantial daily variation. Nor does it establish that the same pattern persists outside the selected dates.
A monthly headline would also need a different window. This review begins in September and ends before October is complete. Calling the sum “October’s total” would mislabel the data. The phrase thirty-date review is deliberate: the coverage is precisely specified, while the source’s finalization and intraday boundary conventions remain limitations.
The reconciliation uses the unrounded decimals, although the display table rounds each block to cents. A tiny difference caused by adding display-rounded values should be investigated at that display precision before being treated as missing activity. A material difference requires checking row membership, duplicates and the underlying field selection.
This additional check asks a different question from the median calculation. The partition tests whether the total can be traced to complete nonoverlapping subsets. The median describes the position of observations in a sorted distribution. Both are useful, but one does not validate the other’s interpretation automatically. We retained both results and their methods rather than presenting a single unexplained headline number.
A reproducible calculation from a saved file
The official token-transfer analysis reference documents the request and dated USD-amount fields used here. Our additions are the selected thirty-date table, local arithmetic, distribution summaries and comparison rules. No wallet connection or signing operation was used to obtain or analyze the public response.
- Keep the scope fixed. Record TRON, the complete contract, the source endpoint, retrieval time and selected dates. Do not combine another chain’s token into this review.
- Save the original response. Keep the numeric strings and source dates together. A screenshot of a rounded chart is insufficient to reproduce the exact arithmetic.
- Select the window before aggregating. Retain dates 27 September through 26 October inclusive. Require thirty unique consecutive dates.
- Use decimal arithmetic. Sum the source USD amounts before rounding. Do not round each row to billions and then add the rounded labels.
- Recompute every summary for the same rows. Calculate the sum, daily mean, median, extrema and two seven-date sums from this one retained set.
- Preserve the limits beside the result. These values concern transfer amounts. Leave count, user, issuance and inflow claims unmade unless different evidence supports them.
The following standard-library Python example reads a saved response called usdt-activity.json. We ran it locally against our retained file on 27 October and checked its output against the table and summary above. It performs no network request or wallet operation.
import json
from pathlib import Path
from decimal import Decimal, getcontext
from datetime import date, timedelta
from statistics import median
getcontext().prec = 45
data = json.loads(Path("usdt-activity.json").read_text(encoding="utf-8"))
rows = sorted((date.fromisoformat(r["day"]), Decimal(r["usd_amount"]))
              for r in data["data"]
              if "2026-09-27" <= r["day"] <= "2026-10-26")
assert len(rows) == 30
assert len({d for d, value in rows}) == 30
assert all(rows[i][0] - rows[i-1][0] == timedelta(days=1)
           for i in range(1, len(rows)))
values = [value for day, value in rows]
assert all(value >= 0 for value in values)
print("sum", sum(values))
print("mean", sum(values) / Decimal(30))
print("median", median(values))
print("lowest", min(rows, key=lambda row: row[1]))
print("highest", max(rows, key=lambda row: row[1]))
prior = sum(values[-14:-7])
recent = sum(values[-7:])
print("prior seven", prior, "recent seven", recent)
print("percent change", (recent - prior) / prior * 100)
The expected sum is 734471080079.418540, the recent seven-date sum is 179996712537.487035 and the preceding sum is 176102015330.353849. A different response may produce different observations. Preserve that new collection time rather than presenting the new output as our original snapshot.
What to check when a result disagrees
Start with the input dates. Our response contained thirty-five dates but this article analyzes thirty. A reader summing all returned rows will correctly obtain a different total for a different question. The row count printed by the checker should make that mismatch visible.
Next compare the metric. The amount field is denominated in the source’s USD measure. A transfer-count endpoint, a token-unit field or a wallet balance cannot be substituted into the same calculation. If units differ, apparent disagreement may be a scope mismatch rather than a calculation failure.
Check display rounding only after the scope matches. The graphic’s $734.471 billion is a readable approximation of the full computed total. Multiplying a three-decimal-billion label back into dollars cannot recover every original decimal digit.
If the same source date and field change in a later retrieval, keep both snapshots and label the difference. Do not remove an inconvenient observation or overwrite a report’s checking date. A correction should explain whether the source changed, the calculation changed or the original interpretation exceeded the evidence.
An assertion failure is also evidence. It may expose duplicate rows, a date gap or a response structure change. Do not disable checks merely to obtain a total. Review the source and decide whether a narrower, clearly labeled comparison remains possible.
Separate activity, token amount and supply
The token-amount versus USD-value guide explains why those fields should be kept separate. This distinction remains necessary even when a token is designed to track a dollar. A source’s USD amount is a reported valuation measure, not a direct receipt for reserve assets.
Supply is a stock at an observation point. USDT activity accumulates recorded movements over dates. Our dated TRON USDT supply analysis uses a different response and date window. We do not divide this thirty-date transfer amount by that fourteen-date closing supply to invent an unlabeled adoption or circulation metric.
There is also no ownership conclusion in this report. A transfer amount does not reveal a beneficial owner, a customer count or the purpose of a movement. Reading those claims into an aggregate series would make the analysis less accurate, not more informative.
The practical success standard is a reproducible aggregate with honest units and dates. A reader should be able to see which rows entered the calculation, reproduce the summaries and understand what further evidence would be needed for another question.
For independent reuse, describe this USDT activity dataset with its full date range and collection time. A file name containing only “October” would conceal the September observations. Keep the original numeric strings with the saved response so that another reviewer can distinguish display rounding from an actual change in the underlying amount.
Frequently asked questions
How much USDT activity does this report measure?
Approximately $734.471 billion in source-defined transfer USD amounts over thirty dated observations. It is not a thirty-day net-inflow estimate.
Why is the median higher than the daily mean?
The measures summarize the distribution differently. Lower observations pull the arithmetic mean below the median in this retained series; the report does not attribute their cause.
Did activity rise in the most recent seven-date window?
The saved transfer-amount sum for 20-26 October is about 2.212% higher than 13-19 October. This comparison does not establish a persistent trend or growth in unique people.
Does the report prove that the data is finalized?
No. The dates precede the collection date, but source finalization and revision behavior were not independently certified. Later snapshots must retain their own retrieval times.
Can these numbers confirm my own deposit?
No. Check the correct public transaction and recipient, then use the receiving service’s private credit record where necessary. Aggregate activity cannot establish a particular customer’s credit.
Editorial note: Tronscan News produced this independent review with AI assistance, original diagrams and local decimal calculations. The saved response and code were checked on 27 October 2026. No reserve investigation, individual-address attribution or live wallet test was performed. Corrections information is available through About & Standards in the site navigation.
Use the Tronscan News home page to find the main guides and related dated reviews.
Leave a Reply