The saved TRON account growth response contains two counters that do not reconcile over our selected thirty-date window. Daily newAddressSeen values sum to 5,142,200, while the change in totalAddress between the opening and closing boundaries is 4,872,916. The unexplained difference is 269,284.
These are observations about source-reported fields, not a claim that 5.14 million new people joined TRON. We preserve the mismatch rather than adjusting one field until it matches another. The response was collected on 27 October 2026 at 05:31:29 UTC.
This original audit covers category dates 27 September through 26 October and uses 26 September as the opening cumulative boundary. The current-date row was excluded. Prior-date coverage does not independently certify that the provider will never revise the observations.
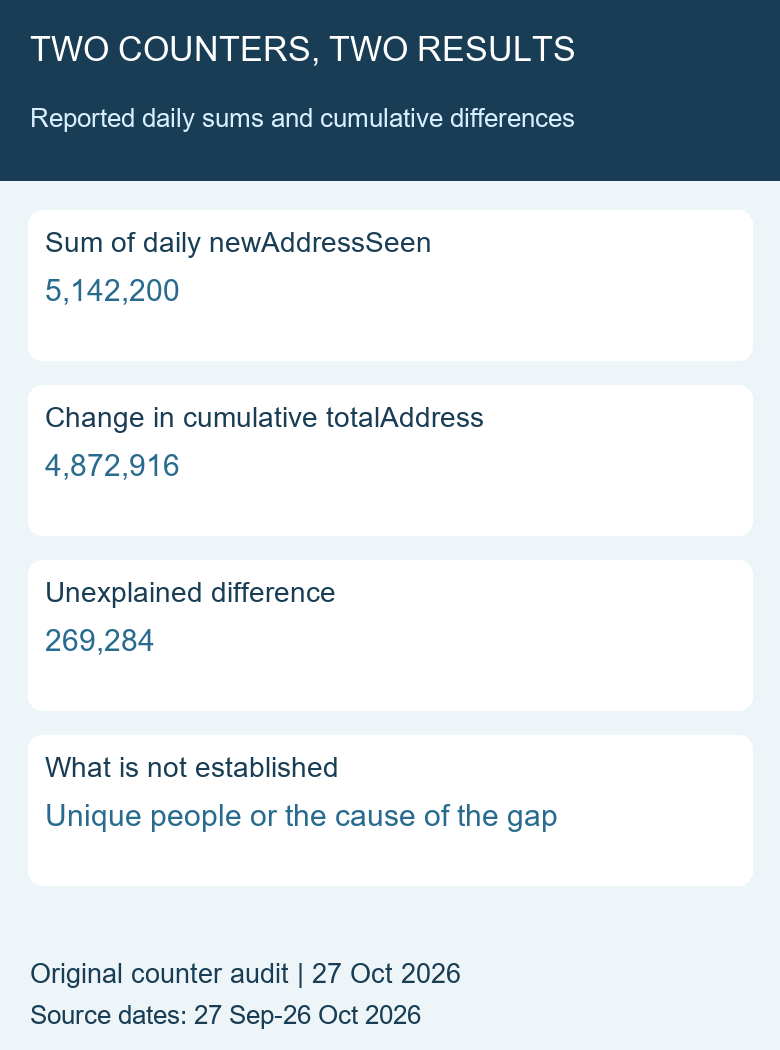
Table of Contents
Account growth begins with a defined counter
The official daily-account API reference documents dated new-address and cumulative-address fields. We selected the date strings and integers from the saved response, retained an opening boundary and calculated each comparison locally.
A counter called new addresses and a count of people are different entities. This dataset does not identify beneficial owners, customers or unique human users. It also does not establish why an address appeared or whether a person uses multiple addresses.
The TRONSCAN guide covers choosing and reading a public account record. This account growth audit asks a separate question: whether two aggregate source counters support the same thirty-date arithmetic.
The opening and closing boundaries matter
For the thirty dates beginning 27 September, the cumulative opening observation is the preceding date, 26 September. Its retained totalAddress is 406,072,822. The closing observation on 26 October is 410,945,738.
Subtracting those levels gives 4,872,916. Subtracting the first date inside the window instead would omit its boundary interval and answer another question. Retaining the previous observation makes the chosen interval explicit.
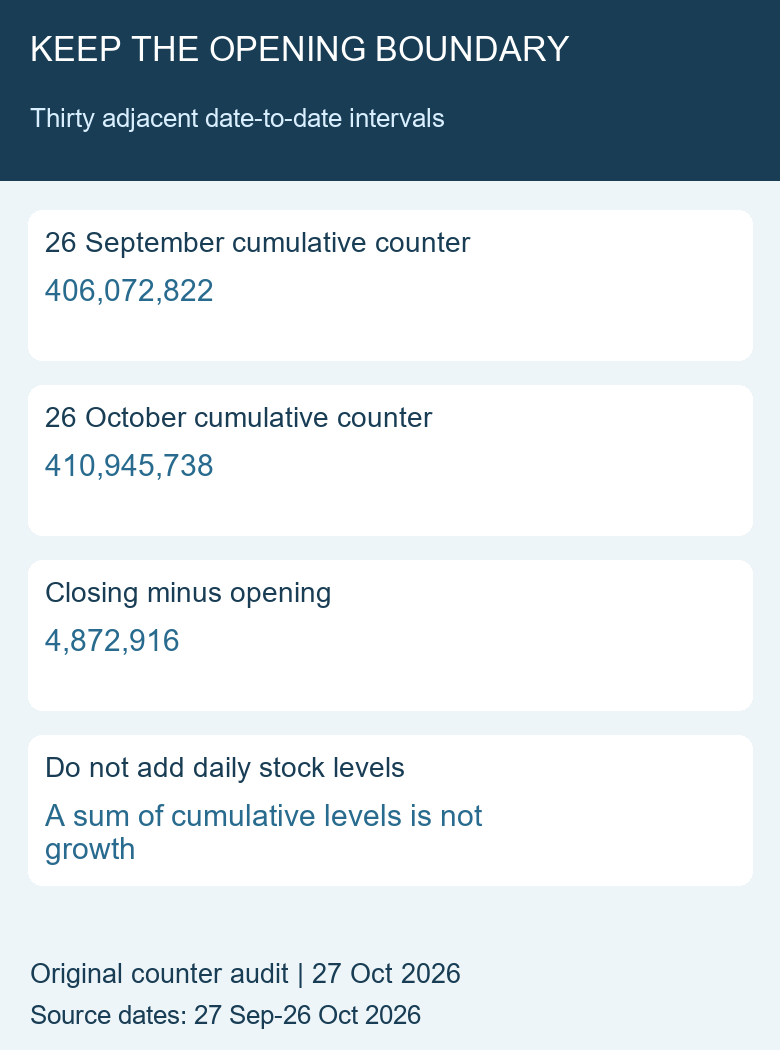
There are thirty date-to-date intervals in this comparison because the opening boundary precedes the thirty retained daily dates. That differs from a table of thirty levels compared only from its first to last level, which would contain twenty-nine internal intervals.
The thirty-date account growth reconciliation
For each date, we subtract the preceding cumulative level from the current cumulative level. The residual is the source’s daily new-address field minus that adjacent cumulative difference. This sign convention is retained throughout the table.
| Source date | Daily newAddressSeen | Adjacent totalAddress change | Residual |
|---|---|---|---|
| 2026-09-27 | 156,943 | 146,970 | 9,973 |
| 2026-09-28 | 207,723 | 187,757 | 19,966 |
| 2026-09-29 | 164,674 | 144,722 | 19,952 |
| 2026-09-30 | 188,515 | 168,527 | 19,988 |
| 2026-10-01 | 180,239 | 160,269 | 19,970 |
| 2026-10-02 | 165,377 | 145,428 | 19,949 |
| 2026-10-03 | 134,200 | 114,188 | 20,012 |
| 2026-10-04 | 134,885 | 114,829 | 20,056 |
| 2026-10-05 | 164,243 | 144,302 | 19,941 |
| 2026-10-06 | 193,832 | 173,952 | 19,880 |
| 2026-10-07 | 165,975 | 149,565 | 16,410 |
| 2026-10-08 | 166,254 | 166,258 | -4 |
| 2026-10-09 | 169,116 | 169,140 | -24 |
| 2026-10-10 | 161,848 | 161,870 | -22 |
| 2026-10-11 | 145,944 | 145,963 | -19 |
| 2026-10-12 | 173,620 | 173,651 | -31 |
| 2026-10-13 | 181,119 | 181,130 | -11 |
| 2026-10-14 | 193,345 | 193,377 | -32 |
| 2026-10-15 | 186,194 | 186,218 | -24 |
| 2026-10-16 | 206,682 | 206,717 | -35 |
| 2026-10-17 | 156,437 | 156,424 | 13 |
| 2026-10-18 | 148,425 | 148,451 | -26 |
| 2026-10-19 | 198,399 | 178,676 | 19,723 |
| 2026-10-20 | 173,048 | 153,114 | 19,934 |
| 2026-10-21 | 179,621 | 170,570 | 9,051 |
| 2026-10-22 | 181,050 | 166,439 | 14,611 |
| 2026-10-23 | 181,749 | 181,738 | 11 |
| 2026-10-24 | 155,959 | 155,927 | 32 |
| 2026-10-25 | 149,266 | 149,301 | -35 |
| 2026-10-26 | 177,518 | 177,443 | 75 |
Every retained date has a nonzero residual in this snapshot. The residuals sum to 269,284, exactly matching the difference between the thirty daily counter sum and the opening-to-closing cumulative change.
This identity checks our arithmetic. It does not prove that the two upstream fields were intended to be identical measures under every reporting condition. We did not obtain an independent provider explanation for the discrepancy and do not assign it to a specific filtering, revision or collection mechanism.
Work through a date without running code
For 27 September, begin with the previous cumulative counter of 406,072,822 and the current cumulative counter of 406,219,792. Closing minus opening is 146,970. The separately returned daily new-address field is 156,943. Under the report’s sign convention, the residual is therefore 156,943 minus 146,970, or 9,973.
This worked account growth comparison uses the same source response for every input. It does not mix a current website counter with an older exported row. Keeping the inputs together is important: a comparison assembled from different retrievals can introduce an additional freshness question before the field-definition question has even been examined.
For 28 September, the preceding cumulative value is the 27 September closing level, 406,219,792. The next closing level is 406,407,549, giving an adjacent change of 187,757. The daily field reports 207,723, so the residual is 19,966. These figures reproduce the second selected row without using a percentage or an average.
The change in residual from one date to another does not explain its cause. The arithmetic merely shows where the two measures differ. It would be inappropriate to name the residual “removed users” or “unverified accounts” because those categories are not supplied by this calculation. Keep a neutral residual column until an appropriate definition or explanation supports another label.
The smallest daily-field observation provides another useful check. On 3 October the daily field is 134,200, while the adjacent cumulative change is 114,188. Their residual is 20,012. A low daily observation does not make the cross-field difference disappear, and this single date cannot be substituted for the complete thirty-date comparison.
There are two kinds of arithmetic agreement in this worksheet. First, adjacent cumulative changes add to the overall closing-minus-opening difference because the intermediate boundaries cancel. Second, the residuals add to the difference between the daily-field sum and cumulative change. Both identities help detect a row-selection or subtraction mistake. Neither independently establishes that the daily field and cumulative counter represent identical upstream populations.
That distinction is essential when reading test results. A script can correctly reproduce an unresolved source-counter mismatch. Its successful execution is evidence that the documented method ran and the arithmetic is consistent; it is not evidence that the mismatch was explained. Our report retains the successful local checks and the unresolved cross-field equality question as separate outcomes.
A reader can use the same manual method on another date before running the whole file. Copy the preceding and current cumulative values, calculate their signed difference, then subtract that result from the same date’s daily field. Preserve the date labels and collection time with the three inputs so that a later reviewer can reproduce the same account growth observation.
Describe the daily field without changing its meaning
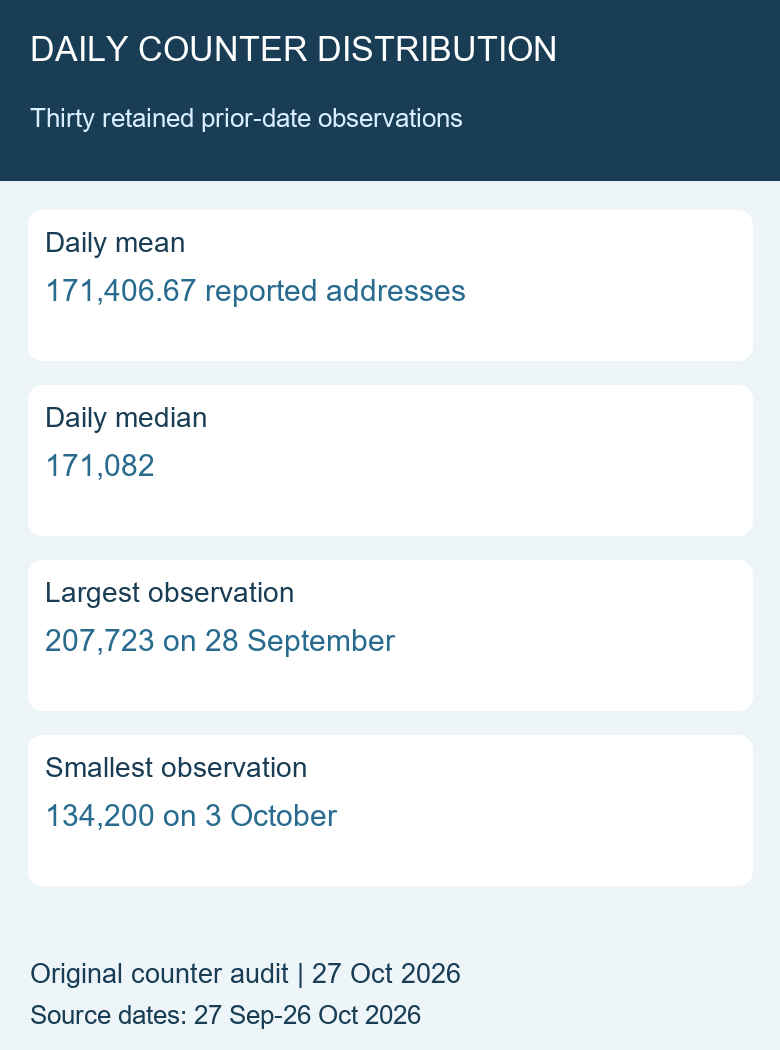
The arithmetic mean of the thirty newAddressSeen observations is approximately 171,406.67. The median is 171,082. These summaries concern the daily field itself, not the separate cumulative differences.
The largest daily observation is 207,723 on 28 September. The smallest is 134,200 on 3 October. These are extrema within the selected dates, not historical records or predictions for future account growth.
Do not switch between a daily new-address sum and a cumulative-counter change because one produces a larger headline. State the field and calculation used. A report can show both with their mismatch, as this one does, without pretending that they have already been reconciled.
Reproduce the account growth audit
- Retain the original response. Save the source endpoint, request range and collection time. Keep the raw integers and category dates together.
- Choose the dates explicitly. Select 27 September through 26 October inclusive and retain the 26 September cumulative boundary. Exclude the current-date row.
- Check date coverage. Require thirty distinct consecutive source dates. Missing observations should remain missing rather than being replaced by zero.
- Compute two measures separately. Sum the daily new-address field, then subtract the cumulative opening level from the closing level. Do not assume equality in advance.
- Compute daily residuals. Compare each daily field with its corresponding adjacent cumulative difference using one consistent sign convention.
- Reconcile the reconciliation. The sum of cumulative differences should equal the endpoint difference, and summed residuals should equal the difference between the two headline measures.
- Preserve the unresolved finding. If the two source measures differ, disclose the difference and its unverified cause. Do not edit the input to make the audit pass.
The following standard-library Python example reads our saved response file. We ran it locally on 27 October and checked the output against the table. It performs no network request and does not inspect private accounts or operate a wallet.
import json
from pathlib import Path
from datetime import date, timedelta
data = json.loads(Path("accounts-publication-source.json").read_text(encoding="utf-8"))
rows = sorted(data["data"], key=lambda row: row["dateDayStr"])
opening = next(row for row in rows if row["dateDayStr"] == "2026-09-26")
window = [row for row in rows
          if "2026-09-27" <= row["dateDayStr"] <= "2026-10-26"]
assert len(window) == 30
days = [date.fromisoformat(row["dateDayStr"]) for row in window]
assert len(set(days)) == 30
assert all(days[i] - days[i-1] == timedelta(days=1)
           for i in range(1, len(days)))
prior = opening["totalAddress"]
changes, residuals = [], []
for row in window:
    change = row["totalAddress"] - prior
    changes.append(change)
    residuals.append(row["newAddressSeen"] - change)
    prior = row["totalAddress"]
reported = sum(row["newAddressSeen"] for row in window)
net = window[-1]["totalAddress"] - opening["totalAddress"]
assert sum(changes) == net
assert sum(residuals) == reported - net
print("daily counter sum", reported)
print("cumulative change", net)
print("unexplained difference", sum(residuals))
print("nonzero residual dates", sum(value != 0 for value in residuals))
The expected output for this snapshot is a daily counter sum of 5,142,200, cumulative change of 4,872,916, residual of 269,284 and thirty nonzero residual dates. A later response may contain revisions; preserve its own collection time and output.
Which checks passed, and which question remains open?
The selected window contains thirty unique consecutive dates. The opening boundary is present. The adjacent cumulative changes telescope exactly to the endpoint difference, and the residual sum reconciles to the difference between the two measures. These are local data-selection and arithmetic checks.
The cross-field equality question does not pass: the daily new-address sum differs from the cumulative-counter change. We record that outcome separately from the successful arithmetic checks. Calling every check “passed” would conceal the main finding.
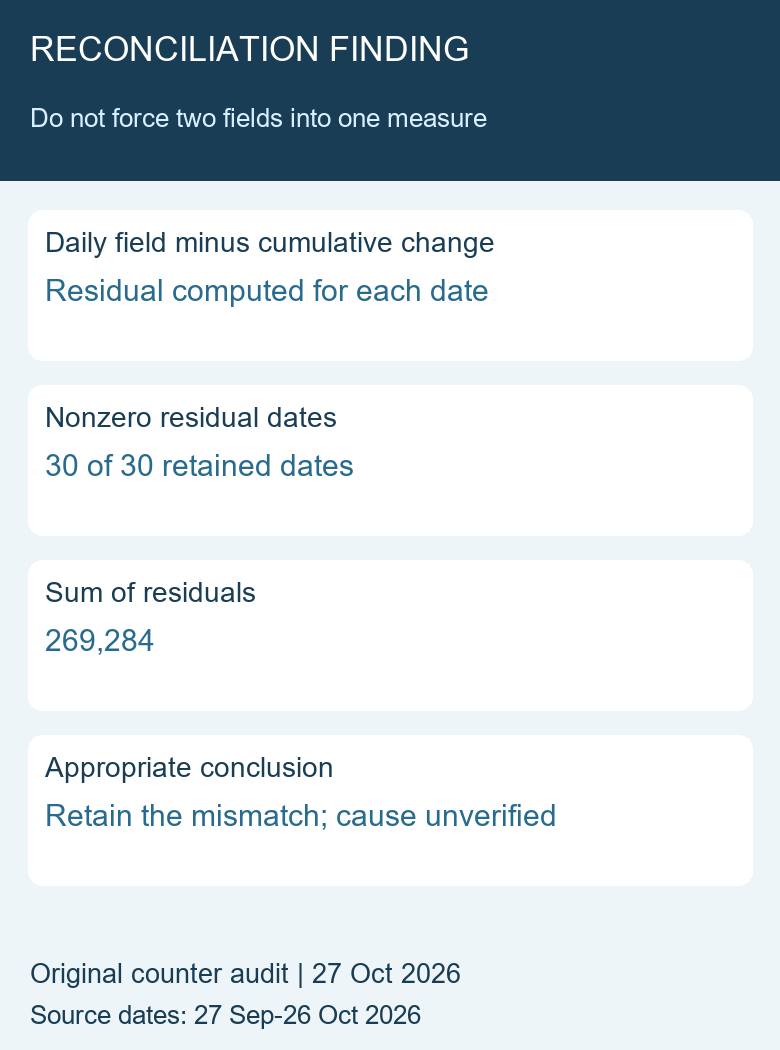
We also have no unique-person count, independent reconstruction of account creation or certification of the provider’s finalization process. None of those follows from successful subtraction. A useful audit keeps these boundaries visible rather than converting numerical precision into an unsupported claim of completeness.
Check timestamp units before aligning dates
The response provides both a millisecond timestamp and a category-date string. We separately converted the thirty selected timestamps to UTC dates and compared them with their date strings. All thirty matched in the retained file. This check concerns date labeling; it does not resolve the account growth residual.
Use the documented millisecond unit for this field. Treating a thirteen-digit millisecond value as Unix seconds would change the interpreted time drastically. Conversely, dividing an already second-based value by one thousand would also be wrong. Preserve the field name and unit with the saved response instead of applying one universal conversion to every timestamp.
Keep timezone presentation explicit. This report uses the source date strings for selecting rows and UTC when describing the independent timestamp check. A reader displaying the timestamp in another timezone should not silently replace the source category date and then compare the shifted window with this one.
The point is to avoid a false explanation. A date-label mismatch could invalidate a comparison, so it is worth checking. Here the retained UTC labels match, while the daily and cumulative counter measures still differ. We therefore do not claim that an observed timezone shift explains the discrepancy. The unresolved account growth finding remains exactly as recorded.
Keep current-date and cumulative observations separate
The response included a row labeled with the collection date. We excluded that row because this article’s selection ends on 26 October. Its existence does not establish that a complete current-date period has elapsed or that its amount is comparable to a prior full-date observation.
A cumulative counter on that partial date can still be an observation, but using it changes the endpoint and scope. Do not append it to a prior-date report without changing the selection rule, date labels and interpretation.
For a later account growth review, choose a fresh window and retain the preceding boundary again. Reusing an old opening observation with a newly extended closing date can be appropriate only when that longer interval is stated clearly and missing dates are handled honestly.
Do not equate address growth with asset activity
The dated USDT transfer-activity review measures source-defined transfer USD amounts. It is a different dataset and entity. A change in one aggregate cannot by itself explain a change in another.
One person may control several addresses, and repeated transfers can involve existing addresses. The account growth response does not provide the attribution needed to connect its counters to a number of new customers or a specific asset’s adoption.
Our account-label interpretation guide addresses a related attribution limit. A label beside an address is not a complete ownership or identity record. An aggregate count has even less individual attribution information.
Report a mismatch without inventing its cause
A reviewable statement is: “In the response collected at the stated time, the daily field sum exceeds the selected cumulative change by 269,284; the cause was not independently established.” That tells another reviewer exactly what can be reproduced.
Do not describe the residual as deleted accounts, bots, fake users or a confirmed provider error without further evidence. Those are causal interpretations absent from the saved fields. This audit reports a measurement boundary and unresolved reconciliation, not an accusation.
If a later response changes the same dated observations, keep both snapshots and rerun the same method. Distinguish a source revision from a code change. A correction note should explain which input or calculation changed and whether it altered the conclusion.
The practical success standard for this account growth audit is traceability: fixed dates, preserved counters, explicit arithmetic and an honest unresolved result where the source fields do not agree. A larger headline without those details would provide less useful evidence.
Frequently asked questions
How much account growth does the daily field report?
The thirty selected newAddressSeen observations sum to 5,142,200. We label it as a source-reported address counter, not a unique-person count.
Why is the cumulative change different?
The retained cumulative change is 4,872,916, producing a residual of 269,284. The cause was not independently established, so the report does not assign a specific explanation.
Why use 26 September as an opening boundary?
It precedes the first retained daily date and allows thirty adjacent intervals to be compared with thirty daily counter observations.
Were current-date observations included?
No. The selected window ends on 26 October. A row labeled 27 October was excluded rather than treated as a complete comparable period.
Does the audit prove new people or USDT users joined?
No. Address counters do not independently identify unique people, customers, asset ownership or the purpose of an account.
Editorial note: Tronscan News prepared this independent account growth audit with AI assistance, original figures and local calculations on 27 October 2026. Sources were public aggregate statistics. No private account, wallet operation or provider-internal system was tested. Corrections information is available through About & Standards.
Find the main guides and other dated analyses at the Tronscan News home page.
Leave a Reply